Tides are described as the rise and fall of sea levels caused by gravitational forces exerted by the Moon, the Sun and the rotation of the Earth.
You can use tidal information from your charts and almanac to maximise the efficiency of your sail. Sailing against a strong tide will slow down your passage so it is important to plan your passage. You may also need a certain tidal height to pass over a tidal gate or bar when entering a harbour.
Characteristics of Tides
There are four stages of tides:
- Water rises to its highest level – called high tide.
- Sea level drops over several hours to show the intertidal zone – called ebb tide.
- Water stops falling and is at its lowest level – called low tide.
- Sea level rises to recover the intertidal zone – called flood tide.
When the tide is about to reach its highest or lowest point and the tidal current ceases we call it slack water or slack tide. Although in some places, slack water is not close to high or low tide. When the tide is about to reverse direction it is said to be on the turn or turning.
Tides can be semi-diurnal (two high and low waters per day) or diurnal (one high and low tide per day). The two high and low waters are not the same height on each day. They are called the higher high water, the lower high water, the higher low water and the lower low water on tide tables.
Tidal Range
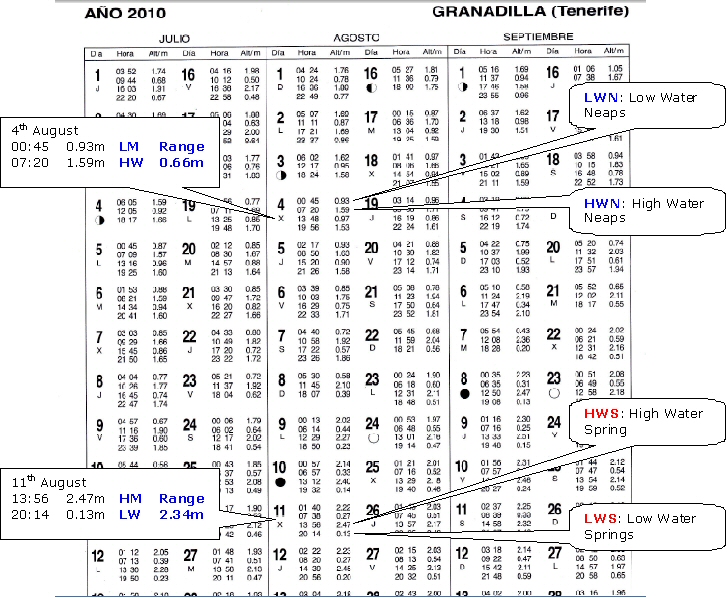
The monthly gravitational pull of the moon and the sun affect our tides. If the Sun, Moon, and Earth are aligned (new or full moon) it creates a large tidal range with extremely high high-tides and very low low-tides. These are called Spring tides.
Around 7 days later, the sun and moon form a right angle to each other (1st and 3rd quarter half moon) and this creates a lower tidal range with moderately sized tides. These are called Neap tides.
 Tide Tables
Tide tables are used to predict tides and show the daily times and heights of high water (HW) and low water (LW) in a certain area. Tide tables are accompanied by tidal curves for each location. Tidal curves enable you to predict tide heights at intermediate times. Another way to predict these is to use the less accurate rule of twelfths.
Standard Ports
The tide tables directly list tidal predictions for Standard ports. These predictions are made through continuous observation of the tides in one location for a minimum of a year. In your Almanac or Admiralty Tide Tables, you will find that Standard ports are marked with bold lettering.
Secondary Ports
Whereas Standard ports are listed, you have to calculate the tides for Secondary ports based on the location and relevant tidal curve.
Online resources
We recommend the UK Hydrographic Office – Admiralty EasyTide: http://www.ukho.gov.uk/easytide/EasyTide/index.aspx


